


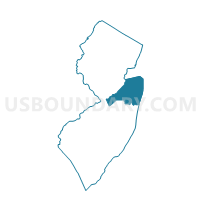
Middletown township, Monmouth County, New Jersey
About
Outline

Summary
| Unique Area Identifier | 142347 |
| Name | Middletown township |
| County | Monmouth County |
| State | New Jersey |
| Area (square miles) | 58.73 |
| Land Area (square miles) | 40.99 |
| Water Area (square miles) | 17.75 |
| % of Land Area | 69.79 |
| % of Water Area | 30.21 |
| Latitude of the Internal Point | 40.40730640 |
| Longtitude of the Internal Point | -74.07112110 |
| Total Population | 66,522 |
| Total Housing Units | 24,959 |
| Total Households | 23,962 |
| Median Age | 42.5 |
Maps

Graphs
Select a template below for downloading or customizing gragh for Middletown township, Monmouth County, New Jersey


Neighbors
Neighoring County Subdivision (by Name) Neighboring County Subdivision on the Map
- Atlantic Highlands borough, Monmouth County, NJ
- Colts Neck township, Monmouth County, NJ
- County subdivisions not defined, Monmouth County, NJ
- Fair Haven borough, Monmouth County, NJ
- Hazlet township, Monmouth County, NJ
- Highlands borough, Monmouth County, NJ
- Holmdel township, Monmouth County, NJ
- Keansburg borough, Monmouth County, NJ
- Red Bank borough, Monmouth County, NJ
- Rumson borough, Monmouth County, NJ
- Sea Bright borough, Monmouth County, NJ
- Tinton Falls borough, Monmouth County, NJ
Top 10 Neighboring Place (by Population) Neighboring Place on the Map
- Tinton Falls borough, NJ (17,892)
- Red Bank borough, NJ (12,206)
- Keansburg borough, NJ (10,105)
- Rumson borough, NJ (7,122)
- Lincroft CDP, NJ (6,135)
- Fair Haven borough, NJ (6,121)
- Highlands borough, NJ (5,005)
- Atlantic Highlands borough, NJ (4,385)
- Port Monmouth CDP, NJ (3,818)
- Fairview CDP, NJ (3,806)
Top 10 Neighboring Elementary School District (by Population) Neighboring Elementary School District on the Map
- Tinton Falls Borough School District, NJ (19,033)
- Red Bank Borough School District, NJ (12,206)
- Colts Neck Township School District, NJ (10,142)
- Oceanport Borough School District, NJ (7,244)
- Rumson Borough School District, NJ (7,122)
- Fair Haven Borough School District, NJ (6,121)
- Highlands Borough School District, NJ (5,005)
- Atlantic Highlands Borough School District, NJ (4,385)
Top 10 Neighboring Secondary School District (by Population) Neighboring Secondary School District on the Map
- Freehold Regional School District, NJ (191,692)
- Monmouth Regional School District, NJ (31,742)
- Red Bank Regional School District, NJ (21,965)
- Shore Regional School District, NJ (18,620)
- Rumson-Fair Haven Regional School District, NJ (13,243)
- Henry Hudson Regional School District, NJ (9,390)
Top 10 Neighboring Unified School District (by Population) Neighboring Unified School District on the Map
- Middletown Township School District, NJ (66,522)
- Hazlet Township School District, NJ (20,334)
- Holmdel Township School District, NJ (16,773)
- Keansburg Borough School District, NJ (10,105)
- School District Not Defined (Water), NJ (0)
Top 10 Neighboring State Legislative District Lower Chamber (by Population) Neighboring State Legislative District Lower Chamber on the Map
- General Assembly District 12, NJ (235,457)
- General Assembly District 13, NJ (219,626)
- General Assembly District 11, NJ (205,526)
- State House Districts not defined, NJ (0)
Top 10 Neighboring State Legislative District Upper Chamber (by Population) Neighboring State Legislative District Upper Chamber on the Map
- State Senate District 12, NJ (235,457)
- State Senate District 13, NJ (219,626)
- State Senate District 11, NJ (205,526)
- State Senate Districts not defined, NJ (0)
Top 10 Neighboring 111th Congressional District (by Population) Neighboring 111th Congressional District on the Map
- Congressional District 4, NJ (724,596)
- Congressional District 12, NJ (701,881)
- Congressional District 6, NJ (668,806)
Top 10 Neighboring Census Tract (by Population) Neighboring Census Tract on the Map
- Census Tract 8033, Monmouth County, NJ (6,600)
- Census Tract 8008, Monmouth County, NJ (6,460)
- Census Tract 8032.02, Monmouth County, NJ (6,202)
- Census Tract 8015, Monmouth County, NJ (6,135)
- Census Tract 8037, Monmouth County, NJ (6,121)
- Census Tract 8009, Monmouth County, NJ (5,996)
- Census Tract 8013, Monmouth County, NJ (5,988)
- Census Tract 8016, Monmouth County, NJ (5,522)
- Census Tract 8006.01, Monmouth County, NJ (5,472)
- Census Tract 8045, Monmouth County, NJ (5,278)
Top 10 Neighboring 5-Digit ZIP Code Tabulation Area (by Population) Neighboring 5-Digit ZIP Code Tabulation Area on the Map
- 07748, NJ (28,030)
- 07701, NJ (23,813)
- 07724, NJ (21,710)
- 07733, NJ (16,849)
- 07734, NJ (13,269)
- 07722, NJ (10,209)
- 07760, NJ (9,283)
- 07716, NJ (8,574)
- 07718, NJ (6,263)
- 07704, NJ (6,133)
Data
Demographic, Population, Households, and Housing Units
** Data sources from census 2010 **
Show Data on Map
Download Full List as CSV
Download Quick Sheet as CSV
| Subject | This Area | Monmouth County | New Jersey | National |
|---|---|---|---|---|
| POPULATION | ||||
| Total Population Map | 66,522 | 630,380 | 8,791,894 | 308,745,538 |
| POPULATION, HISPANIC OR LATINO ORIGIN | ||||
| Not Hispanic or Latino Map | 62,953 | 569,441 | 7,236,750 | 258,267,944 |
| Hispanic or Latino Map | 3,569 | 60,939 | 1,555,144 | 50,477,594 |
| POPULATION, RACE | ||||
| White alone Map | 62,456 | 520,716 | 6,029,248 | 223,553,265 |
| Black or African American alone Map | 869 | 46,443 | 1,204,826 | 38,929,319 |
| American Indian and Alaska Native alone Map | 67 | 1,211 | 29,026 | 2,932,248 |
| Asian alone Map | 1,730 | 31,258 | 725,726 | 14,674,252 |
| Native Hawaiian and Other Pacific Islander alone Map | 8 | 211 | 3,043 | 540,013 |
| Some Other Race alone Map | 537 | 18,187 | 559,722 | 19,107,368 |
| Two or More Races Map | 855 | 12,354 | 240,303 | 9,009,073 |
| POPULATION, SEX | ||||
| Male Map | 32,178 | 306,654 | 4,279,600 | 151,781,326 |
| Female Map | 34,344 | 323,726 | 4,512,294 | 156,964,212 |
| POPULATION, AGE (18 YEARS) | ||||
| 18 years and over Map | 50,288 | 480,081 | 6,726,680 | 234,564,071 |
| Under 18 years | 16,234 | 150,299 | 2,065,214 | 74,181,467 |
| POPULATION, AGE | ||||
| Under 5 years | 3,776 | 34,755 | 541,020 | 20,201,362 |
| 5 to 9 years | 4,497 | 41,128 | 564,750 | 20,348,657 |
| 10 to 14 years | 4,909 | 45,551 | 587,335 | 20,677,194 |
| 15 to 17 years | 3,052 | 28,865 | 372,109 | 12,954,254 |
| 18 and 19 years | 1,526 | 15,179 | 225,990 | 9,086,089 |
| 20 years | 571 | 6,803 | 108,760 | 4,519,129 |
| 21 years | 601 | 6,340 | 106,219 | 4,354,294 |
| 22 to 24 years | 1,952 | 21,042 | 326,259 | 12,712,576 |
| 25 to 29 years | 2,856 | 32,536 | 553,139 | 21,101,849 |
| 30 to 34 years | 3,035 | 32,324 | 556,662 | 19,962,099 |
| 35 to 39 years | 4,001 | 38,474 | 588,379 | 20,179,642 |
| 40 to 44 years | 5,216 | 48,025 | 649,918 | 20,890,964 |
| 45 to 49 years | 6,067 | 56,500 | 704,516 | 22,708,591 |
| 50 to 54 years | 5,847 | 54,479 | 674,680 | 22,298,125 |
| 55 to 59 years | 4,967 | 44,570 | 565,623 | 19,664,805 |
| 60 and 61 years | 1,741 | 15,499 | 201,084 | 7,113,727 |
| 62 to 64 years | 2,584 | 21,619 | 279,458 | 9,704,197 |
| 65 and 66 years | 1,245 | 11,326 | 149,028 | 5,319,902 |
| 67 to 69 years | 1,686 | 14,868 | 201,944 | 7,115,361 |
| 70 to 74 years | 1,977 | 18,148 | 260,462 | 9,278,166 |
| 75 to 79 years | 1,613 | 15,444 | 215,715 | 7,317,795 |
| 80 to 84 years | 1,389 | 13,154 | 179,233 | 5,743,327 |
| 85 years and over | 1,414 | 13,751 | 179,611 | 5,493,433 |
| MEDIAN AGE BY SEX | ||||
| Both sexes Map | 42.50 | 41.30 | 39.00 | 37.20 |
| Male Map | 41.20 | 39.90 | 37.40 | 35.80 |
| Female Map | 43.50 | 42.60 | 40.30 | 38.50 |
| HOUSEHOLDS | ||||
| Total Households Map | 23,962 | 233,983 | 3,214,360 | 116,716,292 |
| HOUSEHOLDS, HOUSEHOLD TYPE | ||||
| Family households: Map | 18,241 | 163,389 | 2,226,606 | 77,538,296 |
| Husband-wife family Map | 15,227 | 129,797 | 1,643,377 | 56,510,377 |
| Other family: Map | 3,014 | 33,592 | 583,229 | 21,027,919 |
| Male householder, no wife present Map | 791 | 8,991 | 154,134 | 5,777,570 |
| Female householder, no husband present Map | 2,223 | 24,601 | 429,095 | 15,250,349 |
| Nonfamily households: Map | 5,721 | 70,594 | 987,754 | 39,177,996 |
| Householder living alone Map | 4,861 | 58,515 | 811,221 | 31,204,909 |
| Householder not living alone Map | 860 | 12,079 | 176,533 | 7,973,087 |
| HOUSEHOLDS, HISPANIC OR LATINO ORIGIN OF HOUSEHOLDER | ||||
| Not Hispanic or Latino householder: Map | 23,022 | 218,483 | 2,777,617 | 103,254,926 |
| Hispanic or Latino householder: Map | 940 | 15,500 | 436,743 | 13,461,366 |
| HOUSEHOLDS, RACE OF HOUSEHOLDER | ||||
| Householder who is White alone | 22,808 | 200,188 | 2,340,060 | 89,754,352 |
| Householder who is Black or African American alone | 291 | 16,743 | 428,304 | 14,129,983 |
| Householder who is American Indian and Alaska Native alone | 24 | 370 | 8,686 | 939,707 |
| Householder who is Asian alone | 556 | 9,406 | 223,319 | 4,632,164 |
| Householder who is Native Hawaiian and Other Pacific Islander alone | 1 | 62 | 925 | 143,932 |
| Householder who is Some Other Race alone | 143 | 4,428 | 152,495 | 4,916,427 |
| Householder who is Two or More Races | 139 | 2,786 | 60,571 | 2,199,727 |
| HOUSEHOLDS, HOUSEHOLD TYPE BY HOUSEHOLD SIZE | ||||
| Family households: Map | 18,241 | 163,389 | 2,226,606 | 77,538,296 |
| 2-person household Map | 6,523 | 59,930 | 812,884 | 31,882,616 |
| 3-person household Map | 4,407 | 38,358 | 539,679 | 17,765,829 |
| 4-person household Map | 4,482 | 38,662 | 498,316 | 15,214,075 |
| 5-person household Map | 1,989 | 17,498 | 228,492 | 7,411,997 |
| 6-person household Map | 615 | 5,693 | 86,142 | 3,026,278 |
| 7-or-more-person household Map | 225 | 3,248 | 61,093 | 2,237,501 |
| Nonfamily households: Map | 5,721 | 70,594 | 987,754 | 39,177,996 |
| 1-person household Map | 4,861 | 58,515 | 811,221 | 31,204,909 |
| 2-person household Map | 763 | 10,282 | 144,798 | 6,360,012 |
| 3-person household Map | 62 | 984 | 18,350 | 992,156 |
| 4-person household Map | 25 | 476 | 7,791 | 411,171 |
| 5-person household Map | 7 | 203 | 3,235 | 126,634 |
| 6-person household Map | 3 | 84 | 1,302 | 48,421 |
| 7-or-more-person household Map | 0 | 50 | 1,057 | 34,693 |
| HOUSING UNITS | ||||
| Total Housing Units Map | 24,959 | 258,410 | 3,553,562 | 131,704,730 |
| HOUSING UNITS, OCCUPANCY STATUS | ||||
| Occupied Map | 23,962 | 233,983 | 3,214,360 | 116,716,292 |
| Vacant Map | 997 | 24,427 | 339,202 | 14,988,438 |
| HOUSING UNITS, OCCUPIED, TENURE | ||||
| Owned with a mortgage or a loan Map | 15,399 | 131,005 | 1,532,012 | 52,979,430 |
| Owned free and clear Map | 4,905 | 44,152 | 570,453 | 23,006,644 |
| Renter occupied Map | 3,658 | 58,826 | 1,111,895 | 40,730,218 |
| HOUSING UNITS, VACANT, VACANCY STATUS | ||||
| For rent Map | 263 | 5,271 | 92,118 | 4,137,567 |
| Rented, not occupied Map | 13 | 318 | 4,578 | 206,825 |
| For sale only Map | 220 | 2,838 | 39,260 | 1,896,796 |
| Sold, not occupied Map | 48 | 739 | 8,145 | 421,032 |
| For seasonal, recreational, or occasional use Map | 188 | 11,101 | 134,903 | 4,649,298 |
| For migrant workers Map | 0 | 13 | 156 | 24,161 |
| Other vacant Map | 265 | 4,147 | 60,042 | 3,652,759 |
| HOUSING UNITS, OCCUPIED, AVERAGE HOUSEHOLD SIZE BY TENURE | ||||
| Total: Map | 2.77 | 2.66 | 2.68 | 2.58 |
| Owner occupied Map | 2.89 | 2.80 | 2.79 | 2.65 |
| Renter occupied Map | 2.09 | 2.25 | 2.47 | 2.44 |
| HOUSING UNITS, OCCUPIED, TENURE BY RACE OF HOUSEHOLDER | ||||
| Owner occupied: Map | 20,304 | 175,157 | 2,102,465 | 75,986,074 |
| Householder who is White alone Map | 19,536 | 157,603 | 1,717,602 | 63,446,275 |
| Householder who is Black or African American alone Map | 168 | 7,045 | 171,748 | 6,261,464 |
| Householder who is American Indian and Alaska Native alone Map | 18 | 188 | 3,523 | 509,588 |
| Householder who is Asian alone Map | 404 | 7,519 | 137,287 | 2,688,861 |
| Householder who is Native Hawaiian and Other Pacific Islander alone Map | 1 | 32 | 375 | 61,911 |
| Householder who is Some Other Race alone Map | 80 | 1,309 | 45,382 | 1,975,817 |
| Householder who is Two or More Races Map | 97 | 1,461 | 26,548 | 1,042,158 |
| Renter occupied: Map | 3,658 | 58,826 | 1,111,895 | 40,730,218 |
| Householder who is White alone Map | 3,272 | 42,585 | 622,458 | 26,308,077 |
| Householder who is Black or African American alone Map | 123 | 9,698 | 256,556 | 7,868,519 |
| Householder who is American Indian and Alaska Native alone Map | 6 | 182 | 5,163 | 430,119 |
| Householder who is Asian alone Map | 152 | 1,887 | 86,032 | 1,943,303 |
| Householder who is Native Hawaiian and Other Pacific Islander alone Map | 0 | 30 | 550 | 82,021 |
| Householder who is Some Other Race alone Map | 63 | 3,119 | 107,113 | 2,940,610 |
| Householder who is Two or More Races Map | 42 | 1,325 | 34,023 | 1,157,569 |
| HOUSING UNITS, OCCUPIED, TENURE BY HISPANIC OR LATINO ORIGIN OF HOUSEHOLDER | ||||
| Owner occupied: Map | 20,304 | 175,157 | 2,102,465 | 75,986,074 |
| Not Hispanic or Latino householder Map | 19,627 | 168,244 | 1,943,837 | 69,617,625 |
| Hispanic or Latino householder Map | 677 | 6,913 | 158,628 | 6,368,449 |
| Renter occupied: Map | 3,658 | 58,826 | 1,111,895 | 40,730,218 |
| Not Hispanic or Latino householder Map | 3,395 | 50,239 | 833,780 | 33,637,301 |
| Hispanic or Latino householder Map | 263 | 8,587 | 278,115 | 7,092,917 |
| HOUSING UNITS, OCCUPIED, TENURE BY HOUSEHOLD SIZE | ||||
| Owner occupied: Map | 20,304 | 175,157 | 2,102,465 | 75,986,074 |
| 1-person household Map | 3,170 | 33,163 | 418,027 | 16,453,569 |
| 2-person household Map | 6,374 | 55,212 | 671,621 | 27,618,605 |
| 3-person household Map | 3,982 | 31,870 | 378,218 | 12,517,563 |
| 4-person household Map | 4,173 | 33,485 | 373,606 | 10,998,793 |
| 5-person household Map | 1,852 | 14,845 | 166,068 | 5,057,765 |
| 6-person household Map | 562 | 4,508 | 58,752 | 1,965,796 |
| 7-or-more-person household Map | 191 | 2,074 | 36,173 | 1,373,983 |
| Renter occupied: Map | 3,658 | 58,826 | 1,111,895 | 40,730,218 |
| 1-person household Map | 1,691 | 25,352 | 393,194 | 14,751,340 |
| 2-person household Map | 912 | 15,000 | 286,061 | 10,624,023 |
| 3-person household Map | 487 | 7,472 | 179,811 | 6,240,422 |
| 4-person household Map | 334 | 5,653 | 132,501 | 4,626,453 |
| 5-person household Map | 144 | 2,856 | 65,659 | 2,480,866 |
| 6-person household Map | 56 | 1,269 | 28,692 | 1,108,903 |
| 7-or-more-person household Map | 34 | 1,224 | 25,977 | 898,211 |
Loading...